It’s been an interesting week.
Coming at organics as a broker and consumer (I only grow on a small scale), I think my primary thought on marketing organic crops is that the market rules. I say this because time and again over the weeks I am approached for a price float on a given organic product but what the producer has in mind is the price spikes of the past few years on their crop. This isn’t unique to organic producers but does seem to be more common. In my opinion the COVID price spikes were an anomaly and will not be repeated. Nor is there any point in planting according to last year’s or two year’s ago prices in the hope of a similar return this year. The market is flat or falling for nearly all products, except organic pulse. There are sudden one-off high price buys but these are the exception, not the rule, and holding out for them is a game of dice. Buyers are contracting into the spring already and prices are not rising. It is my thought that increased costs on the reseller and consumer end of organics is leading to a general price stall because organics are a luxury consumer item and when pressed for cost consumers are forced to shop cheaper. In commodities substitutions reign King. For maximum price, know what it is you’re selling and have it ready. Have lab reports on hand and know what you’ve got precisely. You will not get good, or many bids, if you can’t tell them what they’re trying to buy. Buyers (any of them) want speed and certainty. The best prices are reliably going not to the best crop, though that helps, but to the grower with the fastest and most professional information on their crop. While an elevator report helps, at best it’s considered a guesstimate. We need to remember that there is not a century of status quo on organics. Each deal is unique, each field is unique, each crop is unique. The opportunities are great but so is the potential for loss. Balance is needed. They say the markets are dictated by fear and greed but I have yet to see either quality make for a sensible decision. I do have some thoughts on specific crops. The milling wheat market is being largely driven by specialty millers who must have perfect product. This is not a matter of buyers being whiny or trying to chisel you down, this is a chemical fact. Single source whole wheat flour can be extremely difficult to bake with and the grain that produces it must adhere to defined specs in order to bake a loaf of bread that isn’t a brick (or a massive sponge). Millers want perfect wheat. Buyers pay for perfect wheat. Conventional can hide behind less than perfect because they blend dozens of loads into one; organic can’t do that. There is a ton of organic rye on the market. Most sellers are holding out for a given price. My comment is, take what you can get – you’ll likely get a better price than everybody behind you. There are a ton of organic oats on the market. Take what you can get. It is an opportunity for a grower to create a reliable basic cash flow as the buyers are established and strong but those buyers also name the price. Bread wheats are holding steady in the $21 +/- range. You might get $23 for cleaned product. You might get a premium for Red Fife or named heritage wheat. Take what you can get. If you want to camp out for a price you may be camping out for a lower price. Barley is rare-ish and shows massive price variance. Shop around. Organic pulse is rare and sought for but remember that the other end needs to make a profit and that the product must be quality. If you want a good price and fast transaction for organic mustard sell it cleaned and have spec on hand. Nobody wants to ship dockage. Expect to dicker on prices. Organic flax is strong. If you’re not happy with the price hang tough. For forage and associated specialty seed there’s demand but that market is particularly finicky on purity. Feed grade and screenings have a market as well but the buyers are looking for a deal. It can be a great way to rescue a bad day. Come with fair expectations. To conclude, look at your ROI for each crop and calculate individually and as an aggregate. Don’t sell on wishes sell on reality. The only thing more lame than a low price in January is that same low price in May. Cost of carrying is more real than ever. Bring buyers firm third party information on the crop and have it ready on demand, or better yet present it all up front. Good sellers (as well as good buyers) rise to the top. There is far more room for competitive advantage in organics than in conventional. Much of that advantage simply comes from being willing to take fair prices and offer clear, concise, fast information on what it is you are trying to sell. I might also add that buyers prefer to deal with sellers who are game to sell and not simply floating prices or holding out for the highest bidder. An offer, often as not, doesn’t last the week. Dumping a contract -- which, fortunately, is rare -- in order to hold out for a few more cents is a great way to get cut entirely. To summarize: the best business and best prices are going to good but not necessarily the best product provided by sellers who are willing to sell at a fair price and who provide the information and product the buyer wants quickly and thoroughly. No luck, no unicorn hunts, no kinda-sorta. Those are one man’s thoughts. Sincerely, Andrew Turner Organic Broker, Three Hills AB (587) 287-8447 aturner@qualitygrain.ca
0 Comments
Good Day, Here is a very interesting article on the “Birch affect” in regard to soil fertility levels and the impact dry soil conditions have on the availability and release of nutrients. The article is written by Edgar Hammermeister of Western Ag Professional Agronomy. I have worked with Edgar helping market his grain from the Alameda, SK area for 15 years. As we talked about crop production and soil fertility, I realized he had information every one needs to maximize profits. Take a read and let me or Edgar know what you think. It’s like déjà vu all over again. Yogi Berra As you receive this newsletter, harvest is likely well underway. The warm (to hot) and dry conditions have moved crops quickly into maturity. Across the prairies, there was significant variability in moisture available to start and grow the crop. The varying circumstances not only affects crop yield potential but also nutrient cycling in the soil and can have a large impact on future fertilizer management if it is accounted for. When soils go through extended periods of drying, there are some physical and biological changes that occur. These changes can result in a nitrogen (N) mineralization potential to build and release, a process sometimes referred to as the “Birch Effect”. The greater the organic carbon content of the soil and the longer the dry period, the greater the potential for plant available N to release once a drought ending rain occurs. The potential for N release can range from tens of pounds to over 200 lb/ac depending on what soil zone you are farming in and the condition of your soil. The N mineralization burst is difficult to predict with conventional soil testing. As a result, it has not been talked about much. The conventional residual soil nitrate test measures just that… residual nitrate. It extracts the “left over” or residual nitrate-N and does NOT account for the organic N supply often referred to as “mineralization”. When soils go through drought, the biology shuts down and no N mineralization takes place. If the crop yield was good to average and a dry fall persists, a conventional soil test will read low in nitrate-N because the plants have drained the nitrate-N pool and mineralization of organic N has not yet replenished this nitrate-N pool. Western Ag Professional Agronomy uses the Plant Root Simulator (PRS®) probe technology to measure the nutrient supply power of the soil and a sophisticated computer model, the PRS® CropCaster, to interpret the probe data. The PRS® lab protocol for dry soils, triggers the Birch Effect in the lab and the PRS® analysis is able to measure the plant available N supply power. In the 25 years of CropCasting, the last three years have been some of the most interesting. The dry fall of 2020 saw Western Ag customers significantly reduce N application rates planned for the 2021 crop. No one anticipated the drought, but farmers using PRS CropCasts, did not see the same high soil residual nitrate tests… because the fertilizer N wasn’t in the soil to begin with. The N was safe in the bin, it was better for the environment, and, most of all, it was better for the pocket book. The fall of 2022 showed the same trend, planning for crop year ‘23. There were high N supply rates allowing for reduced N applications at seeding. Should dry conditions persist into the fall, what am I anticipating for the fall of 2023? We have seen this before. Ask any Western Ag Professional Agronomist or farmer customer about how the PRS® CropCaster can compare “What if” scenarios based on changing crop type, fertilizer, weather and economics and help you “Grow More Profit”. https://www.youtube.com/watch?v=LdFSAQmzsZ0 Edgar Hammermeister, PAg C 306-483-7289 me.hammer@westernag.ca www.GrowMoreProfit.com Edgar Hammermeister is a Professional Agrologist and a Western Ag franchise owner located in South East Saskatchewan. He has been providing crop planning services for area farmers since 1998 when the PRS technology first became commercially available for use. Western Ag has over 35 agronomists situated throughout Saskatchewan and Manitoba. The Western Ag PRS CropCasting® service includes soil sampling, lab analysis, cropcasting and a post harvest review called “backcasting”. 
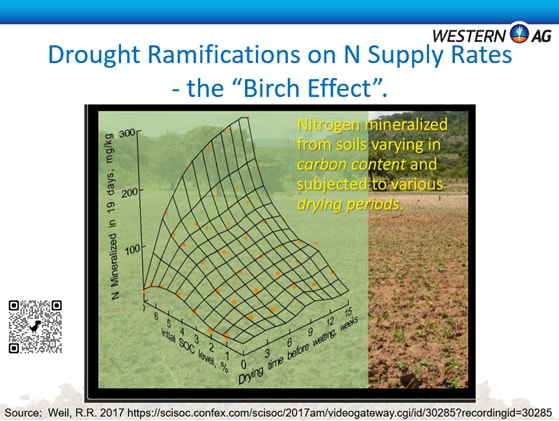
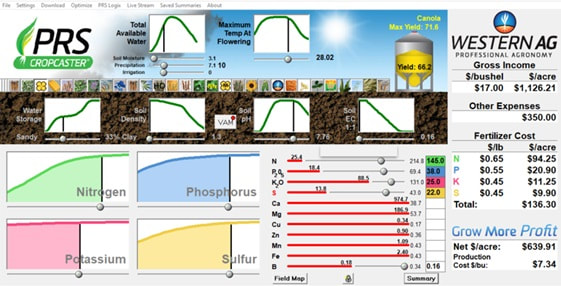
Hope you all found this as interesting as we have. Let me or Edgar know what you think
Till next month, Richard Chambers Marketer - Brandon, MB 204-729-1354 - Office 204-761-8320 - Cell richard@qualitygrain.ca Good Day,
I just got of the phone with a reseller that I have faith in. He tells it as he sees it. We were talking about the price of feed grains and why they are going down as we are heading into the main feeding season. We agreed that there are several reasons but likely the number one reason is that the US grew a decent crop of corn, and the Mississippi River is at a 10 year low. Back in October it was even closed for barge traffic for a short period of time. They moved in and dredged the 2 main shallow spots. This is good but they were only able to open it up to 1 way traffic. This problem is likely to continue into the spring or until the next major moisture falls. This has forced sellers to look elsewhere. Feedlot alley in Southern Alberta has become a major place to ship corn. The number we heard was 20-unit trains have been sold for unload Nov/Jan. This has taken the push away to buy either Canadian corn or barley. This has caused delivered bids Lethbridge to drop $20/MT and FOB farm numbers to drop by corresponding amounts. Barley bids into Lethbridge are now around $445/MT delivered for Jan/Feb/Mar delivery with feedlots having good coverage so far. Will this change and prices go back up? No one will venture a guess on this. I know I won’t. It is something to think about. So far, we have been lucky in Western MB as we still have decent demand from the hogs. This has stopped the drop at $15/MT for now. Just one other thing that the brokers at Quality have been talking about is how there seems to be large volumes of good oats in bins and many producers have $6 on the bin door. We are still seeing our better oat bids ($5.00 picked up – location dependent) being for further out. Many of the buyers are covered until March. Just food for thought. A bit of a heads up for producers in Western MB and Eastern SK. We are hosting a meeting with Western Ag Labs (nitrogen soil testing) and ADM Fertilizer (future price outlook) in Virden at 1:30 PM on Dec 12th at the Legion Hall. I hope many of you can make it as I think it will be interesting. And it would be a chance for us to put faces on many of your voices. Please put it on your calendar. On a final note we have buyers in Manitoba on the lookout for conventional Gluten Free Oats so if you have some and are in MB/Eastern SK let us know what you have and we will price it for you. Till next month. Richard Chambers Marketer - Brandon, MB 204-729-1354 - Office 204-761-8320 - Cell richard@qualitygrain.ca Good Day, We have been getting considerable interest from producers on new crop pricing across all commodities. The prices keep moving down gradually. This is likely the trend for the next while. Right now from what we are hearing there isn’t much reason for the prices to go any other direction. There is a good crop coming. Most producers are saying better than last year and some are saying as good as they have seen. Producers always keep looking for a light at the end of the tunnel. We continually have guys say “look at all the hail that has fallen, I heard of this storm with softball sized hail”. Unfortunately, or fortunately, we have never had enough hail in western Canada to move the markets up or down. If you have had hail, it is a disaster but only for you. It will not significantly affect the supply or price of grain in western Canada. Another thing to consider in the feed grain markets. What happens if it gets down to minus 5C for a night at the end of August or first week of Sept? We will have a million tonnes of feed wheat. This will peel $40/ Mt off the feed grain market overnight. I am not saying this will happen but if it does the $6.25-$6.75 bids we are getting for new crop barley for Sept/first half October movement will look pretty good. Just food for thought. I will now pass it off to Reed to do a hopefully brief mid year review on commodity prices since January. Very similar to my New Years Review highlighting the change in prices in 2021 I will do a same brief summary for what we have been seeing in 2022 while compared with 2021 prices for September. Feed Wheat started the year near $11.50/bus and was driven by world news (Ukraine War) up to highs of $14.40/bus (yes for feed) at the start of may. Prices have now come down fairly rapidly and we are seeing close to $9.25-10.00/bus depending on location picked up in the yard. Feed wheat in September of 2021 was trading around $10.50-11.00 bus off the combine for comparison.
Barleyremained fairly flat throughout 2022, peaking in March at $9.25/bus picked up in the yard and slowly crept down. The highest price we traded for barley in 2022 was $9.50/bus picked up (primarily because of location). Since those highs barley has settled in around $6.75/bus and we suspect it has more room to fall come September as barley volume available increases dramatically. September 2021 barley was $8.00/bus picked up for comparison. Corn has had an interesting year, never matching the MT price until May. Much of this has to do with the amount of Corn that was bought and brought up in the USA in Oct/Nov of 2021. Feed requirements were met as a substitute for barley. Still a couple months before we will have a stronger grasp on the 2022 crop but expectation is most feeders will switch back to barley leaving a large chunk of corn up for grabs into ethanol/distilling. Currently we are seeing off farm bids on corn just shy of $9/bus. Nearly identical to what we were seeing in September of 2021. Oats have had the largest run up and a matching crash. The highest price we traded oats in 2022 was $10/bus picked up in the yard. We heard reports of higher numbers at the line companies but never verified, my understanding was demand was limited. Today good Milling oats are fetching bids in the $4.25/bus picked up in the yard, currently below feed oat bids of $4.50/bus. September 2021 Oats were trading at $6.50/bus for comparison. Yellow Peas are trending a similar direction as oats, but perhaps not as drastically. Yellow Peas hit their top in January at $18/bus but held their own until May where they dropped below $15/bus. Current bids are in the $11.50-$12/bus range for September compared to 2021 bids of $15/bus off the combine. Green Peas I might be one of the few that share this opinion but I feel they have held their own fairly well when compared to the volatility in Yellow Peas. Yellow Peas have fallen $6/bus from their peak while Green peas tickled $14.50/bus in May 2022 (in October 2021 they briefly hit $16.50/bus) and now are in the $10.50-11/bus range. Red Lentils were up around $0.40/lbs in January and have steadily decreased since. The top Red Lentil trade we had was $0.52/lbs fall of 2022. Currently Red Lentils are receiving bids around $0.30-0.31/lbs vs $0.45/lbs in September of 2021. Overall, all I can recommend is if you are worried about bin space or cash flow right now is the time to consider booking in your September/October grain. The line companies will be more than happy to take prompt movement on your grain for prices that were dollars per bushel below what you could have booked in with us a few weeks prior. If you have the ability (financially, storage space, stomach to watch some price swings) to hang on beyond the wave of grain that will be coming off the combines this fall good on you as it is anyone's guess where this market will be come January 2023. Till next month. Today I will be looking at John Deere. Many of you already own the equipment but should you own the Stock? I will be diving into a quick analysis on the Deere (DE) stock traded on the NYSE and the current share price is around $320/share (July 27, 2022). This gives DE a market cap of 97.6 Billion and a PE ratio of 16. I do not have a position long or short in Deere, and all calculations are based on todays share value (roughly $320/share) and the 2021 financial statements. John Deere is a global manufacturer of agricultural, construction equipment, industrial machinery, diesel engines, and lawn and garden equipment. Founded in 1837 by John Deere in Grand Detour, Illinois, it's now headquartered in Moline, Illinois with 70,000+ employees worldwide. DE have been around for over 160 years, but they've only been publicly traded since 2002. They are the largest manufacturer of tractors in the United States. The company originally started as a blacksmith shop owned by John Deere, who also farmed, and in 1886, he built what would become his first tractor. He sold it at an auction in Moline, Illinois for $130 (about $3200 today). 1. As discussed above Deere makes money by manufacturing and selling tractors, engines, and other machinery. Total revenue in 2021 was $44 Billion with 41% of that coming from their equipment operations sales and 57% of total sales coming from USA & Canada. They separate their business into 4 main segments: Production and Precision Agriculture, Small Agriculture and Turf, Construction and Forestry, and Financial Services (FS is John Deere's internal bank for financing/leasing equipment). Sales of equipment are affected by many factors such as farm cash receipts, commodity prices, acreage planted, crop yields, general economic conditions, and government policies just to name a few. While none of these factors are all that predictable Deere believes they will have continued success navigating these waters well into the future. Operating Margins have ranged from 16% to as high as 22%. We have seen revenue grow from $35.6 Billion to $43.58 B which is about a 5% annualized growth over the past 10 years. 2. Deere’s Free Cash Flow (FCF) from the past 10 years is not all that inspiring. I prefer to see a chart stepping up, not 4 years of hugging $2/share mixed in with some negative years and then an absolute explosion into the mid teens. The increase in Net Income in 2021 vs 2020 was $3.2 Billion ($5.9 B vs $2.7 B), for you accounting nerds, I feel like this should have had a greater effect on Operating Cash Flows, however, $2.5 billion in increased inventories and $1.8 Billion in accrued income taxes create similar FCF despite the large increase in earnings. The explosion from 2019 to 2020 is primarily due to inventory management and financing receivables, which seem to be correlated. Financing receivables is a real can of worms which complicates Deere’s operations in the sense they are more of a bank themselves vs strictly a machinery manufacturer + dealer. Based on my limited abilities when it comes to analyzing banks I am suggesting Deere’s FCF is not as simple as looking at this graph and showing steady growing cash flows. However it is clear they did earn $34/share in FCF over the past 10 years vs $21/share the previous decade. 3. Deere competes with companies in both the Agriculture machinery and other heavy duty equipment industries. The competition includes Caterpillar, Kubota, CNH Industrial (Case IH, New Holland), Claas, and AGCO Corp (Challenger, Fendt, Gleaner, Massey Ferguson). By sheer size Deere's closest competitor is CAT and they are neck in neck in terms of market capitalization, revenue generation, and net earnings. Market Capitalization Deere ranks #1 at $97.6 Billion, #2 CAT at $96.94 Billion, and #3 goes to Kubota at $19.5 Billion. Revenue leaders are #1 CAT ($50.97 B), #2 Deere ($43.58 B), #3 CNHI ($33.4 B). Net Earnings - #1 CAT ($6.48 B), #2 Deere ($5.96 B), #3 CNHI ($1.72 B) 4. Deere is one of the most recognized brands in North America, we would be hard pressed to find someone who has never seen or heard of John Deere and their colors. Barriers to enter the industry are fairly large but not impossible to overcome. A company like Tesla could come in with lots of share holder money and a great design and disrupt the industry. We have seen brands such as Claas and Kubota come into the North American market over the past 20 years. While they don’t operate on near the scale Deere does, they have certainly tried and to some extent succeeded in taking some market share away. This is a long winded way of saying anyone can build a tractor, but there is some “secret sauce” in software, engines, design, manufacturing and distribution. Those barriers aren’t impossible to overcome, just expensive and very hard to overturn the “king(s)”. 5. Return on Equity (ROE) is at fantastic numbers for DE averaging 29% over the past 10 years. Return on Income Capital (ROIC - reminder) is not so black and white when considering that a lot of their debt is internal debt from acting as a bank to many of their customers when financing machinery. With this initial skin deep analysis I have not been able to uncover, with certainty, the amount of debt that is “internal” vs money that was borrowed “externally.” Between Short Term and Long Term debt Deere has roughly $43.81 B in debt. According to the notes about the Financial Services in the 10K Annual report $37.978 B is in relation to the Financial Services Operations. If I am correct, the amount of debt Deere uses to finance their operations is closer to $5.8 B making that number pretty insignificant when compared to Earnings, Operating Cash Flow, and Free Cash Flow meaning in that case ROE and ROIC would be very similar. That is a really good sign, but without learning the ins and outs of Deere’s “Financing Services” I for one would be hard pressed to blindly accept the ROE numbers. 6. Extrinsic risks
Political - No major political risks at this point in time. Regulations and laws may change but right now there is nothing that can’t be dealt with. Economical - Fairly large risk if the economical and environmental issues crop up all at once. Farmers take loans from Deere to finance/lease new machinery, flood, drought, natural disaster, etc multiple years in a row over many geographical reasons could spell trouble for Deere’s loan book. Saying that most of the debt is probably secured by collateral such as land and the actual machinery itself. 2008 provides a pretty good insight into how DE navigates through a large scale recession. Socio-cultural - Small/Medium Risk - Deere needs to attract and retain top talents, negotiate with large unions, and ensure their business practices adhere to societal expectations (pollution, safety, etc). Deere currently has a class action lawsuit in regards to the right to repair and many customers are not happy with the subscription based options they have been showcasing the past couple years (link). This last point is an issue DE will have to deal with but at the end of the day the consumers wallet will speak the loudest. Technological - Medium Risk - It is important to Deere to keep improving the technology services they can provide. If a competitor comes out with a vastly superior technology it could tempt loyal customers to switch brands. Smaller risk is having sensitive data being hacked or compromised. This last point is less concerning as we have seen this sort of thing happen in the past (think 2017 Equifax data leak). 7. DE has $8 billion in cash on their balance sheet and $43.8 billion in total debt (majority which is attributed to their “Financial Services” internally and just shy of $6 billion is attributed to outside loans). In 2021 they generated $5.1 billion in free cash flow (FCF). Between free cash flow generated in 2021 and cash on the balance sheet DE would have no issue covering external debt. The "internal debt" created by Financial Services something that I would need to dig deep into to understand whether it is of concern or not. 8. John May is current CEO and Chairman of the board. He has been CEO since November 2019 and has been with John Deere since 1997. John is 51 years old so potentially has a long runway to maintain his positions with Deere. He holds just shy of 74,000 shares (2.48% of total shares) with a market value of $23.6 million. In fiscal year 2020 John received a base salary of $1.2 million and total compensation of $15.58 million (mixture of stocks, options, and performance compensation). This compensation is fairly outrageous, however according to CNBC in 2020 the CEOs of the top 350 US firms made an average of $24.2 million putting John well below average (link). 9. For those who remember the Nutrien valuation, I like to value a company using three separate methods - Free Cash Flow Method, Owner Earnings, and a Simple Intrinsic Value. All values are in USD. Free Cash Flow Method - I am using $8/share FCF compounded at a growth rate of 10% per year. This gives me a $100 in FCF collected over a 8 year period and $315 over 16 year period. Owner Earnings - Using the operating cashflow and subtracting out Capital Expenditures (spending required to keep the lights on and DE competitive) I calculate owner earnings buy price at close to $240/share as a fair value price. Intrinsic Value - For this calculation I use current EPS TTM of $19.17 and extrapolate the growth over the next 10 years. At a 10% growth rate (using the rule of 72 it tells me 10% doubles every 7.2 years) I can estimate the EPS will grow to right around $50. At a growth rate of 10% I can estimate the PE Ratio will be close to 20 (a good estimate is PE is double the growth rate). Using EPS 10 years in the future and multiplying it by a PE ratio of 20 I get a estimated future value of $1,000/share. If you remember from the Nutrien valuation we can use a nice neat 1/4 ratio (representing a 15% rate of return $1 will double twice in 10 years so $1 becomes $4 - hence the 1/4 ratio) we get an estimated share price of $250/share. Based on these three valuation methods it appears fair value of DE is in the $240-315/share range. This shows me DE is either fairly valued or slightly over valued looking at this quick snapshot. Conclusion - For me this company is not currently on sale and I would need to dig into “Financial Services” to determine how money flows through that department and if the $8/share FCF and $19 EPS are numbers that can be grown on. At first glance, even Operating cash flow seems inflated in 2021, but this does not mean these valuations are incorrect but a lot more research needs to be done to get comfortable investing in John Deere at its current price level. Overall I am very curious about owning John Deere, however, the company is more complicated than I had originally anticipated. It might fall into the too hard category but at the same time with a lot more work and research I might be able to understand their financials on a more intimate level. At my current level of comfort I would be very interested in John Deere at $100-150/share price point. I fully anticipate Deere to be around for the next 10-20 years and beyond with the potential to keep improving financially as time goes on. The Stats Canada acreage report was released today showing a nearly 9% increase in wheat acres, 15% drop in barley, 5% drop in Canola, 16% increase in Oats, 12% drop in Peas, and the big surprise 80% increase in Mustard (which still doesn't add up to a whole lot of Mustard acres). Dry beans and flax had notable drops in acres planted as well. What does this all mean? Well it is hard to say. Acres have been shuffled with Wheat and Oats being the biggest winners (minus winter wheat). We still have a way's to go before the combines are rolling but as it stands now on average most of Alberta is looking to have average to above average crops (flooding issues in Northern AB), most of Saskatchewan is looking to have average to slightly below average crops (flooding, late seeding on the Eastern part of SK, and grasshoppers are the main concerns), and Manitoba so far is shaping up to have average to below average crops (lost acres to flooding and late seeding). If things carry along like they have been overall I would expect yields and overall bushels combined to increase dramatically when compared to 2021. going off memory 2020 to 2021 we had something like a 40% drop in yields. To see the report either click on the downloadable file below or follow this Link to the Stats Canada Website ![]()
1. ADM & Marathon Petroleum building a new Soy processing Facility in Jamestown ND - This will be North Dakota's first dedicated soybean processing facility. Construction should be complete by Fall 2023 and expects to process 600 million pounds of vegetable oil per year used by Marathon in the renewable diesel market. 2. Rosetown SK to be the home of a micronutrient fertilizer facility that turns grain left overs into fertilizer - This will be a 50-50 joint venture between AGT and Lucent BioSciences. The fertilizer will be called "Soileos" by reusing pea, lentil, and oat hulls. Early trials on Durum acres have shown promising result at increasing protein content and better soil health. 3. PIP International will be constructing a new pea processing plant in Lethbridge AB that will process 125,000 MT of peas - Construction to start late 2022 on a new $20 million pea processing facility. The 2nd phase of the project will be a $150 million facility that will process 126,000 MT of yellow peas per year for protein extraction. 4. Phyto Organix Foods Inc. is planning to purchase 15 acres of land near Strathmore AB to build a $225 million pea processing facility - Expected to open by 2024, Phyto Organix will be fractionating peas to process 40,000 MT of yellow peas for protein extraction, fibre and starch products, and pea hull fibre. The plant is projected to be the first net zero plant protein processing facility in North America and expects to source peas locally. 5. A financial dive on Nutrien Ltd. - Nutrien (NTR) is a company most of us have heard of and dealt with over the years. They were formed in 2018 as a result of a merger between PotashCorp and Agrium producing Nitrogen, Potash, and Phosphate marking NTR as the world's largest fertilizer producer by capacity. I have this as number 5 today because I know many people aren't interested in investing and will most likely skip over my quick analysis. When investing I like to look at companies that are in my day to day life, Nutrien happens to be a company that shows up fairly frequently. This helps me connect meaning and understanding when considering a possible investment. This is not financial advice and solely my opinion and no one else's. I do not have a position long or short in Nutrien. All calculations are done based on todays stock value of roughly $83/share USD and the 2021 financial statements. 1. As discussed above, NTR makes money by selling Crop Nutrients aka fertilizer. They produce 20% of the global production of Potash, are the #3 global nitrogen producer, and are the 2nd largest North American Phosphate producer. Crop Nutrients made up 41% of their 2021 Revenue and Crop Protection products made up 35% of their revenue. When you break down their Crop Nutrient sales it is made up of 44% Nitrogen, 38% potash, and 18% phosphate. As a business it is evident that NTR is a very cyclical company that relies on the ebbs and flows of the commodity market. When commodity prices increase their margins increase and vice versa. For Example 2021 Margin was 20.2%, 2020 - 9.2%, 2019 - 12.4%, 2018 - 12.8%, 2017 - 10.1%, 2016 - 13.9%, 2015 - 32.3%. 2. NTR generates a positive Free Cash Flow (FCF - the money available for a company to pay creditors, dividends, or buy back stock). Over the past 10 years NTR has ranged from $1/share up to $4.50/share of FCF. In 2021 they generated $571 million which is $3.68/share. When plotting FCF it becomes evident on how cyclical the industry is really highlighting the boom bust nature of the industry. 3. NTR is in a dominate market position in the North American fertilizer industry. By Market Capitalization they are #1 at $40 Billion (next highest is Mosaic at $23 Billion). As discussed earlier they are #3 in global nitrogen production, #2 in North American Phosphate production, and #1 in World Potash. 4. Barriers to become a competing Fertilizer company are massive further illustrating the dominate position NTR is currently in. If you or I wanted to start a company to compete we would need billions of dollars to purchase plants to produce synthetic Nitrogen - not to mention the cost of the inputs to create said nitrogen. As for Phosphate and Potash we would have to discover or purchase large mines to even begin the journey as a competitor. We may see competition from alternative fertilizers if prices continue to swing upwards such as the Rosetown Soileos but it has yet to be proven as a viable alternative (not saying it won't but it hasn't yet) and won't be a threat for years into the future. 5. I personally like to invest in companies that prove they can provide a consistently high return on capital. For these numbers I consider Return on Equity (ROE) and Return on Invested Capital (ROIC). ROE is simply Net Income/Equity, both numbers can be easily found in the financial statements. However, ROIC, factors in the amount of long term debt a company has. For the last 15 years governments around the world have been running easy credit monetary policies providing access to cheap debt, but with rising interest rates debt is a real threat to the health of a company. As of 2021 NTR had long term debt of $7.5 Billion. Using that $570 million in FCF it would take them 3.5 years to pay that down if they allocated a 100% of FCF to the cause. From this chart you can see how debt lowers the ROIC when compared to the ROE. The cyclicality of the business is highlighted by these numbers but it is clear NTR does a good job providing solid returns on their capital.
6. Being in the commodity business relying on commodity pricing and mining operations creates a fair amount of extrinsic risk. When supply out paces demand we see fertilizer prices drop rapidly. This has happened time and time again. Other external risks that need to be considered are Government Regulation, producer defaults, supply chain risks (this proved to be beneficial to NTR during COVID). These risks are external and therefore they can't be controlled by NTR. There are many more internal and external risks to be considered and can easily be found in the companies annual filing (in this case the 40-F filing). 7. NTR has a fairly healthy balance sheet. Biggest strike against them is the $7.5 billion in debt with only 500 million in cash, and generating roughly another $500 million in FCF. The debt to FCF ratio of 3.5 is not a huge concern but definitely something to keep an eye on. The Equity is steadily growing at roughly 5% per year, Earnings which are cyclical have not expanded in 10 year period but stayed much them same, operating cashflow has been similar to earnings, and finally sales have grown on average at annual rate of 9%. 8. Management at NTR has shown high turnover since the Agrium and PotashCorp Merger. Chuck Magro was longtime CEO/President of Agrium and continued with NTR until April 2021 where he left for Corteva (a crop input competitor). In 2021 it was announced Mayo Schmidt would become CEO/President but by January 2022 (after 8 months on the job) he had resigned and Ken Seitz was announced as the interim CEO/President. Ken has been with NTR since 2019 in the Potash department having experience in both agriculture and mining sectors. This turnover leads me to believe it is very hard to manage such a cyclical company in the public traded eye or the company is attracting mercenaries looking for the highest pay cheque. If the later is true that is usually not great for shareholders. 9. I like to run 3 separate valuations based on Free Cash Flow analysis, Owners Earnings, and a Simple Intrinsic Value. These values are all in USD Free Cash Flow Method - I am using an average FCF/share of $2 (that I picked based on looking at 10 years of FCF data) and compounding it at an estimated growth rate. In this example I have come to the conclusion over a 10 year period of time the only thing that appears to be growing is sales at 9% while my other key metrics are closer to 0-5%. For simplicity sakes I will use an 8% overall growth rate. To get this company at a good on sale rate the $2/share FCF at an 8% growth rate in 8 years that would compound to $23/share. In 16 years that would be $43/share pay back. Owners Earnings - Using Operating cashflow and subtracting out capital expenditures required to grow the company (approx 70% is used to maintain the company and 30% used for growth) I come to a rough valuation of $90/share that this company could realistically return to the owners if they decided to sell shop and pack it in. Intrinsic Value - For this calculation I take current Earnings Per shares of $8/share and extrapolate their growth over the next 10 years. In 10 years I would expect that value to double once and grow a tiny bid extra at 8% growth (Rule of 72 makes for quick estimations on growth rates). That grows EPS from $8 to roughly $17/share 10 years from now. Earnings per share work with the Price/Earnings ratio in a way that PE x EPS = Share Price. A rough rule of thumb is a PE ratio is typically twice the Growth rate so in this case 8 x 2 = 16. 16 PE x $17 EPS = $272 Per share 10 years from now. I personally look for a 15% return on my investments meaning I want the investment to double every 5 years (so twice in 10 years). For this to come true I have to buy these shares at 1/4 of the future price for this to reach my 15% target. $272/4 = $68/share is the fair value today (this math is based on the knowledge of Rule of 72 and basic ratios. 72/15 = double every 5 years. So in 10 years $1 would grow to $4 creating a nice neat ratio of 1/4 representing a 15% return hence the $272/4). I am a subscriber to I would prefer to be approximately correct vs precisely wrong so rough numbers work well when calculating valuations. Based on these three different valuation methods I come up with three separate values. $43/share based on free cash flow growth and paying for the company in 16 years. $90/share based on the companies Operating Earnings and subtracting out what it costs to maintain the company every year. And finally $68/share based on the company growing their earnings at 8% annually for the next 10 years. Unfortunately in this case we have come up with 3 fairly different values making the proper value even that much harder to thumb. Personally I would estimate it is somewhere between the $70-90/share that the two methods calculated. At $80/share that would indicate the market has priced this company fairly accurately and is not under priced or grossly overpriced. Conclusion - Running through these quick 9 points is not enough research or thought to determine whether Nutrien is a good stock to buy. My final point on valuation shows they are fairly priced and therefore not really an investment that I am excited about today. NTR is an interesting company and might be worth digging deeper and doing more research to be ready if and when their price follows their next commodity cycle down. At my current level of comfort I would consider purchasing them around $30-40/share USD. I do certainly believe this company will be running strong for the foreseeable future. Being in the commodity business (grain brokerage) we frequently see price fluctuations on our commodities - corn, wheat, canola, etc. I am going to highlight fertilizer, and more specifically one of the largest producers of fertilizer in North America. The Mosaic Co (NYSE:MOS).
The advantage of looking at a company like Mosaic is they are a publicly traded company and have published all of their financial data quarterly for decades. You can track their Earnings, Revenues, Operating Margins, CEO letters, what the CEO said on earnings calls, and so much more. We have been having supply chain challenges on everything and this is creating shortages on fertilizers. With these shortages the North American Fertilizer Price Index is showing prices going from $370 in 2019 to a high of $1270 in 2022 (Link). For reference, the previous high was $930 in 2008. In the news, we get sensationalized headlines stating a company has reached record revenues of unfathomable billions or revenues have grown by large double digit percentages. These headlines are formulated to cause an emotional response. The headline, and in most cases the article do not get down to the bone in details but rather stay superficial on purpose. In 2009 Mosaic had revenues of $10.3 billion compared to 2021 of $12.3 billion (nearly 20% growth over a 11 year period for 1.6% annualized return). Earnings have shrunk from $2.35 billion to $1.63 billion (30% decrease or 3.3% annualized). Operating Margins in 2009 were 23.8% and in 2021 they have shrunk to 22.4%. Compared to 2020 Operating Margins have increased significantly from 8% to 22.4%. Operating margins in 2019 were 6.1% and 8% in 2020. This is a 4x increase on operating margins since 2019. The increase in fertilizer price certainly helps their margins but it appears these returns diminish at certain prices. In this post I will not get into the reasons for these decreases but if readers are interested I can post a much deeper look into what is happening here. One thing that is clear, Mosaic is a cyclical company who relies on prices swings to increase their margins and bolster profits. As a long term investment they may not be the most reliable place to sock your savings as we have pointed out earnings and cash flows have decreased slightly over a 11 year period. Let me know do you think companies like Mosaic are taking advantage of the current market? Should we demand more regulation from governments to cap what these companies can earn when they have the upper hand? Or should we keep our markets free from the invisible hand? India is reeling from the recent heat wave that ravished much of the country over the past couple weeks. They have announced a wheat export ban causing future prices to shoot up on the news (Link).
We are hearing spot elevator bids are approaching $17/bus in Alberta, however, some producers have said elevators aren't buying anymore old crop even though their spot prices are posted. After the past couple years (COVID lockdowns, Russia invading Ukraine, and supply shortages) the health of globalization is starting to be questioned in the news. Some are arguing it is stronger than ever because global trade keeps hitting new records ($28.5 trillion in 2021, up 25% from 2020 (Link)). I for one am curious to see how our world navigates the next 12 months in the face of 8% inflation and numerous questions in the Northern Hemisphere surrounding crop production and quality. Inflation has been running red hot for a couple years now. Feds claimed the inflation was transitory due to COVID lockdowns while at the same time increasing the M2 money supply by record amounts (link).
I cannot fault the central banks of the world for their actions and many claim we would have seen a massive financial crisis if they did not (link to a very well written book on the subject). As expected inflation has hit fiercely and the consumer price index (CPI) is showing over 8% inflation which has not been seen for 40 years (link). Other Black Swan events that have occurred in 2022 contributing are Russia invading Ukraine, and China's zero COVID policy locking down major industrial cities. How are you handling the red hot inflation? Are you noticing changes in your lifestyle to cope with raising prices? Driving less, buying on sale items at the grocery store, changing summer vacation plans? |
AuthorReed McDonald - Owner and chief blogger at Quality Grain Marketing. With all the noise and click bate headlines this agricultural based blog will highlight what current events I am following. Be sure to check in regularly for updated musings Archives
November 2023
|